Appalachian Basin (Includes Marcellus/Utica Shale) - Upstream Oil & Gas

Description

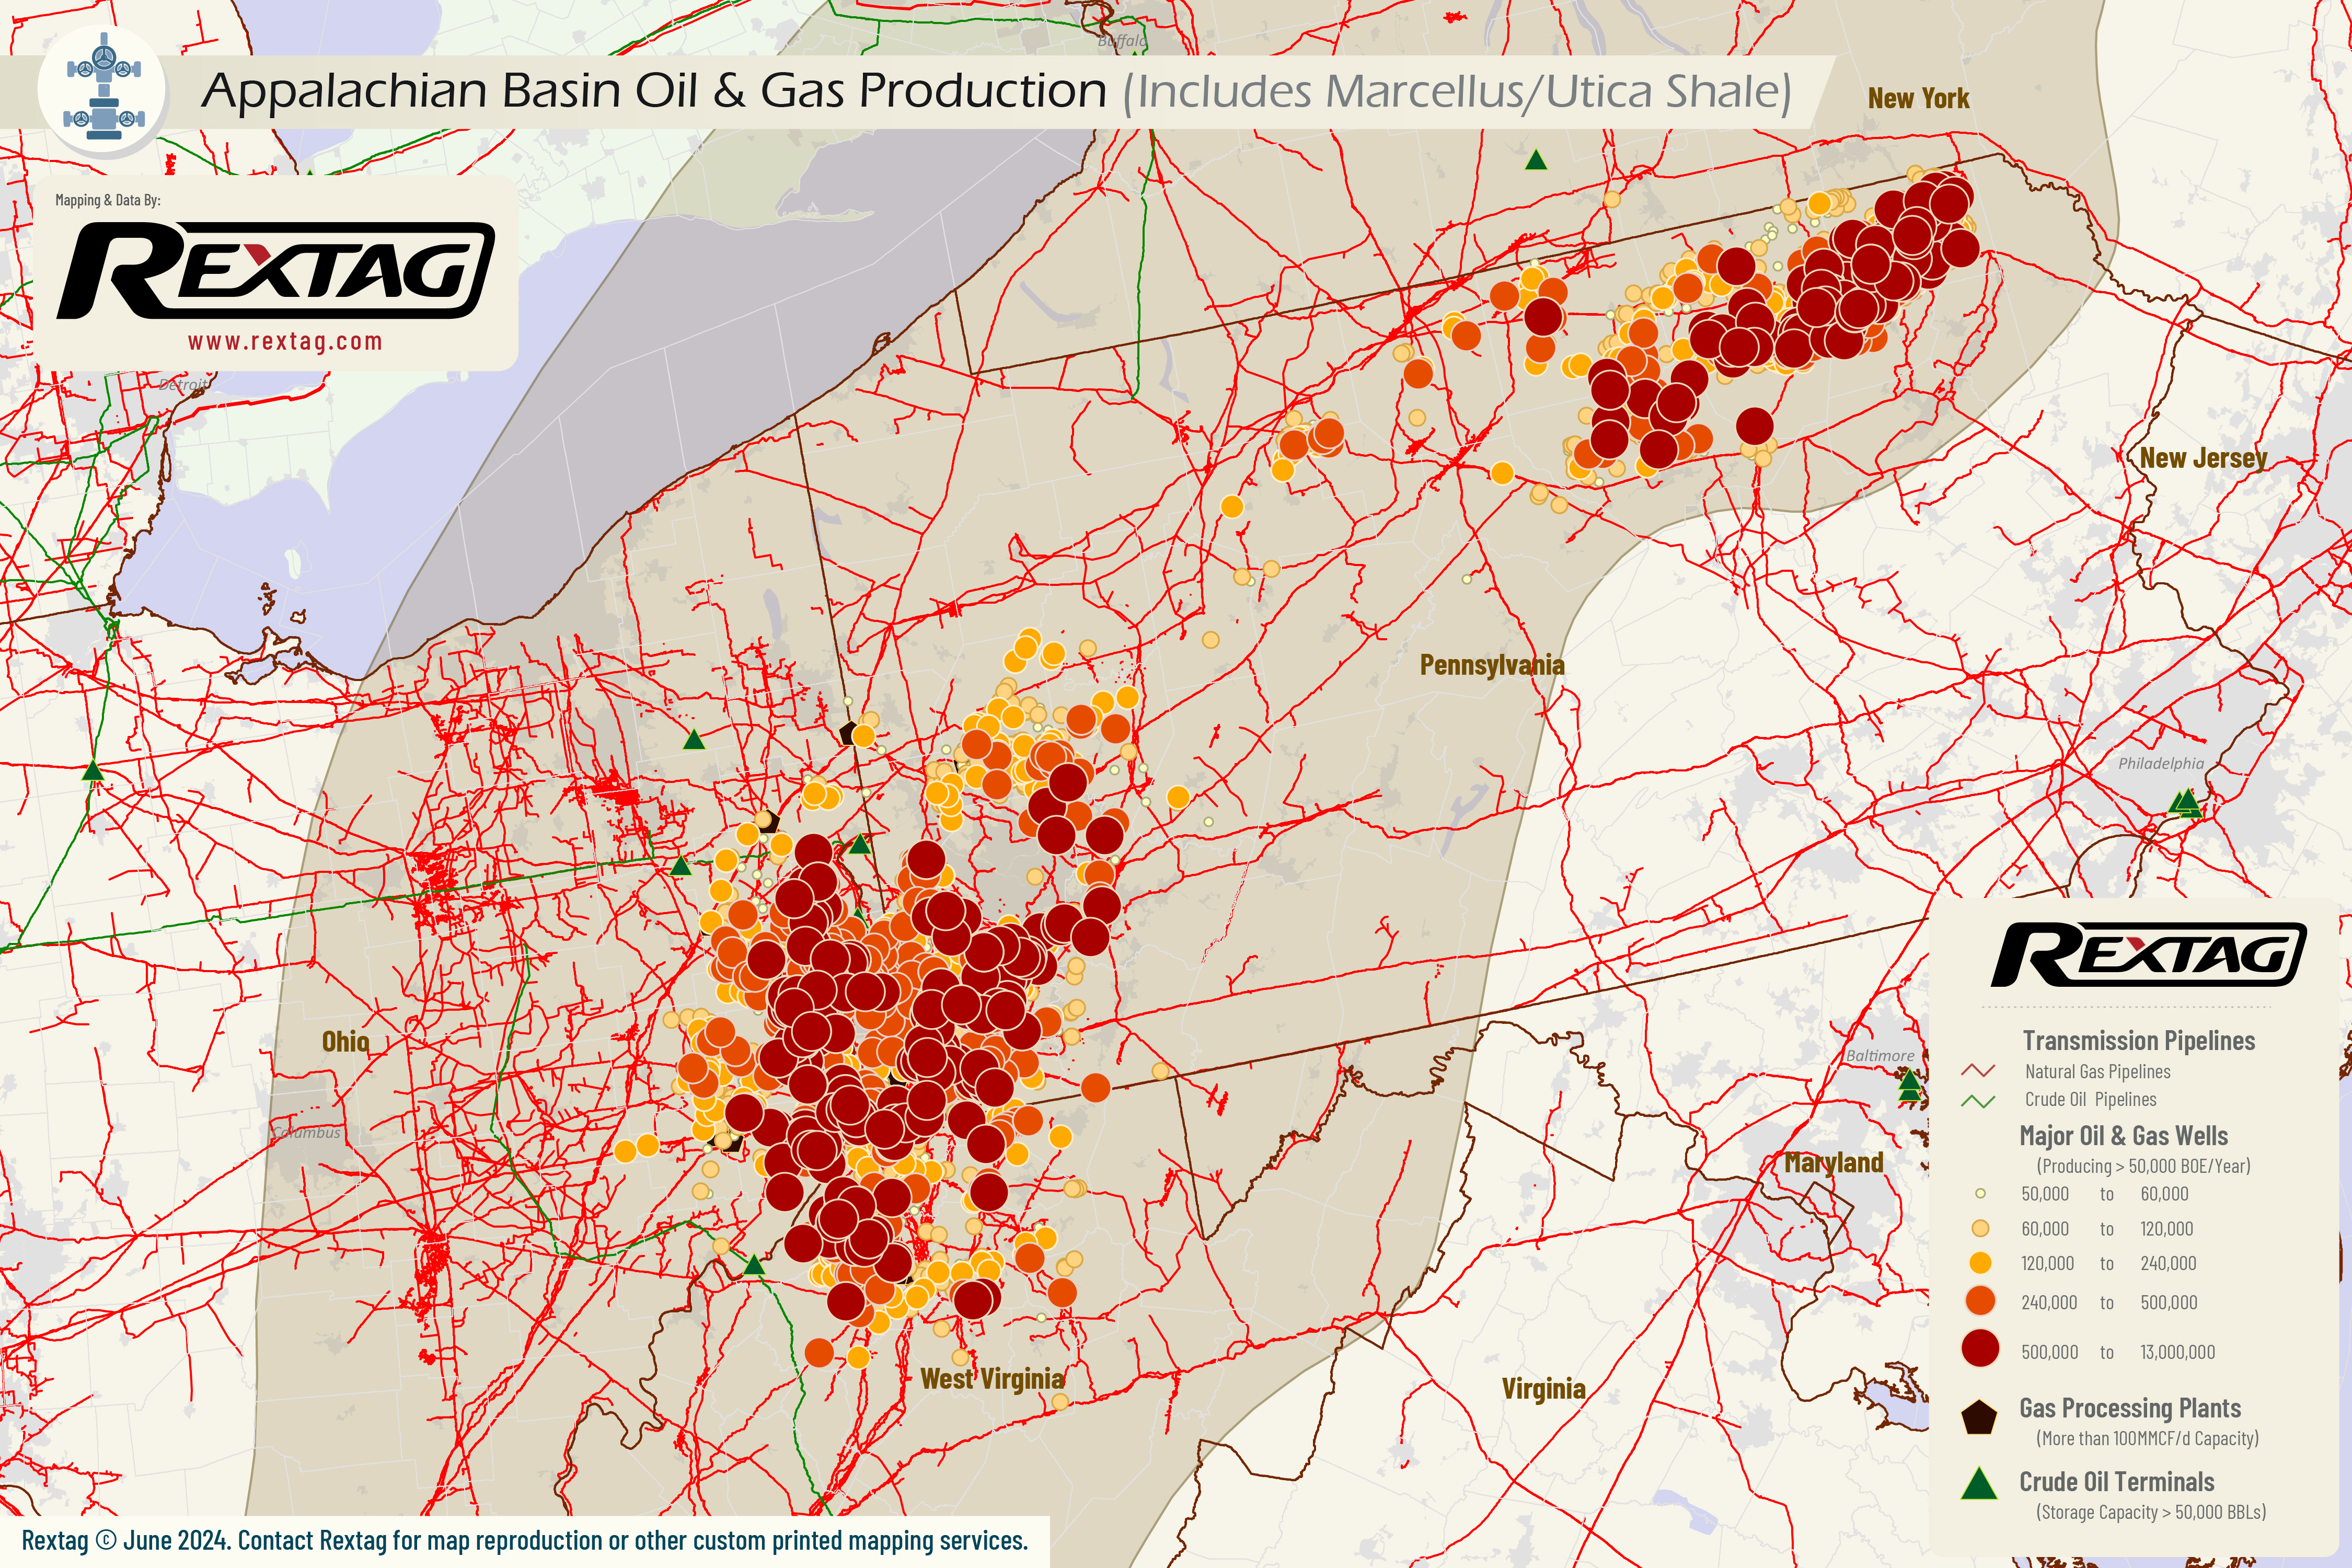
The Appalachian Basin, encompassing the Marcellus and Utica Shale formations across Pennsylvania, Ohio, and West Virginia, is a leading natural gas producer, with an average output of 31.7 billion cubic feet per day in 2021. In 2023, top operators include EQT Corp. (859,302 boe/d), Chesapeake Energy (727,286 boe/d), Antero Resources (455,453 boe/d), Southwestern Energy (441,111 boe/d), and Coterra Energy. At the start of 2023, the daily production was 6,15 million BOE per day and decreased to 4,88 million BOE per day as of December 2023.

upstream oil and gas
Production Summaries
Monthly Production
Presented Data in the chart below is delayed - LOGIN FOR UPTODATE
Production by Operator
Production by Formation
Production by County
Top 10 wells
API Operator Trailing 12 Months BOE Total BOE Total Gas (MCF) Total Oil (BBL)
34-111-24967-0000 SWN Production (Ohio), LLC 1,920,218.50 1,920,218.50 11,521,311.00 0.00
37-059-28169-0000 EQT Production Company 1,875,912.75 1,922,263.71 11,533,582.26 0.00
37-059-28170-0000 EQT Production Company 1,846,468.10 1,895,092.30 11,370,553.83 0.00
34-111-24965-0000 Gulfport Appalachia, LLC 1,764,321.17 1,764,321.17 10,585,927.00 0.00
34-111-24969-0000 Gulfport Appalachia, LLC 1,760,649.67 1,760,649.67 10,563,898.00 0.00
34-013-21531-0000 Gulfport Appalachia, LLC 1,729,037.50 1,729,037.50 10,374,225.00 0.00
34-013-21527-0000 Gulfport Appalachia, LLC 1,716,427.83 1,716,427.83 10,298,567.00 0.00
34-111-24963-0000 SWN Production (Ohio), LLC 1,624,622.67 1,624,622.67 9,747,736.00 0.00
34-013-21538-0000 Ascent Resources Utica Holdings, LLC 1,580,373.67 1,580,373.67 9,119,194.00 60,508.00
34-081-20957-0000 Ascent Resources Utica Holdings, LLC 1,576,730.83 1,576,730.83 9,460,385.00 0.00
Completion Summaries
Avg Depths

Wells Depth

Min
0
Max
34,403
Avg
2,189

Wells Vertical Depth

Min
0
Max
24,400
Avg
1,217

Wells Lateral Length

Min
0
Max
20,674
Avg
120

Wells Measured Depth

Min
0
Max
28,221
Avg
308
Well Counts by Categories

Wells By Formation

Formation
Well Count
Clinton Sand
72,393
Berea Sandstone
27,932
Marcellus
24,694
Big Injun
9,287
Medina
8,856
Benson
8,081
Ohio Shale
8,053
Lower Huron
6,908
Alexander
3,066
Java
3,025

Wells By Status

Status
Well Count
Inactive, P/A
334,585
Active
208,946
Unknown
159,993
Cancelled
71,451
Orphan
8,585
Permitted
5,840
Shut-in
627
Drilling
272

Wells By Trajectory

Trajectory
Well Count
Vertical
700,117
Unknown
50,471
Horizontal
36,909
Directional
1,702

Wells By Operator

Operator
Well Count
Diversified Production
51,375
EQT
11,753
CNX
9,936
OWS Acquisition
6,450
EnerVest
5,603
Minard
5,226
Greylock
4,300
Ows Energy
2,607
Empire
2,427
Vec Energy
1,868
Well Completions
Presented Data in the chart below is delayed - LOGIN FOR UPTODATE
Well Permits
Presented Data in the chart below is delayed - LOGIN FOR UPTODATE
Completion by Operators
Completion by County

Rextag Energy DataLink™ Comprehensive Energy Intelligence Energy DataLink provides the largest and most complete database on energy infrastructure assets in North America. The Energy DataLink database contains asset ownership, production records, processing capacities, physical locations, planned projects, acquisition records and much more.