Ft. Worth/Barnett (Includes Barnett Shale) - Upstream Oil & Gas

Description

The Ft. Worth/Barnett Shale, located in North Texas, remains a significant area for natural gas production despite its decreased prominence compared to its peak years. This region was among the earliest sites of hydraulic fracturing and large-scale shale gas production in the United States. While its production has declined, operators like TotalEnergies still maintain operations in the area. Today, Barnett Shale primarily supplies local utilities, power plants, and industrial operations, maintaining a focus on community and environmental considerations amidst ongoing industrial activities?. As of November 2023, the daily production reached 576,400 BOE per day. For the last 12 months, Barnett Shale produced 120 million cubic feet of natural gas and 806,000 barrels of oil.
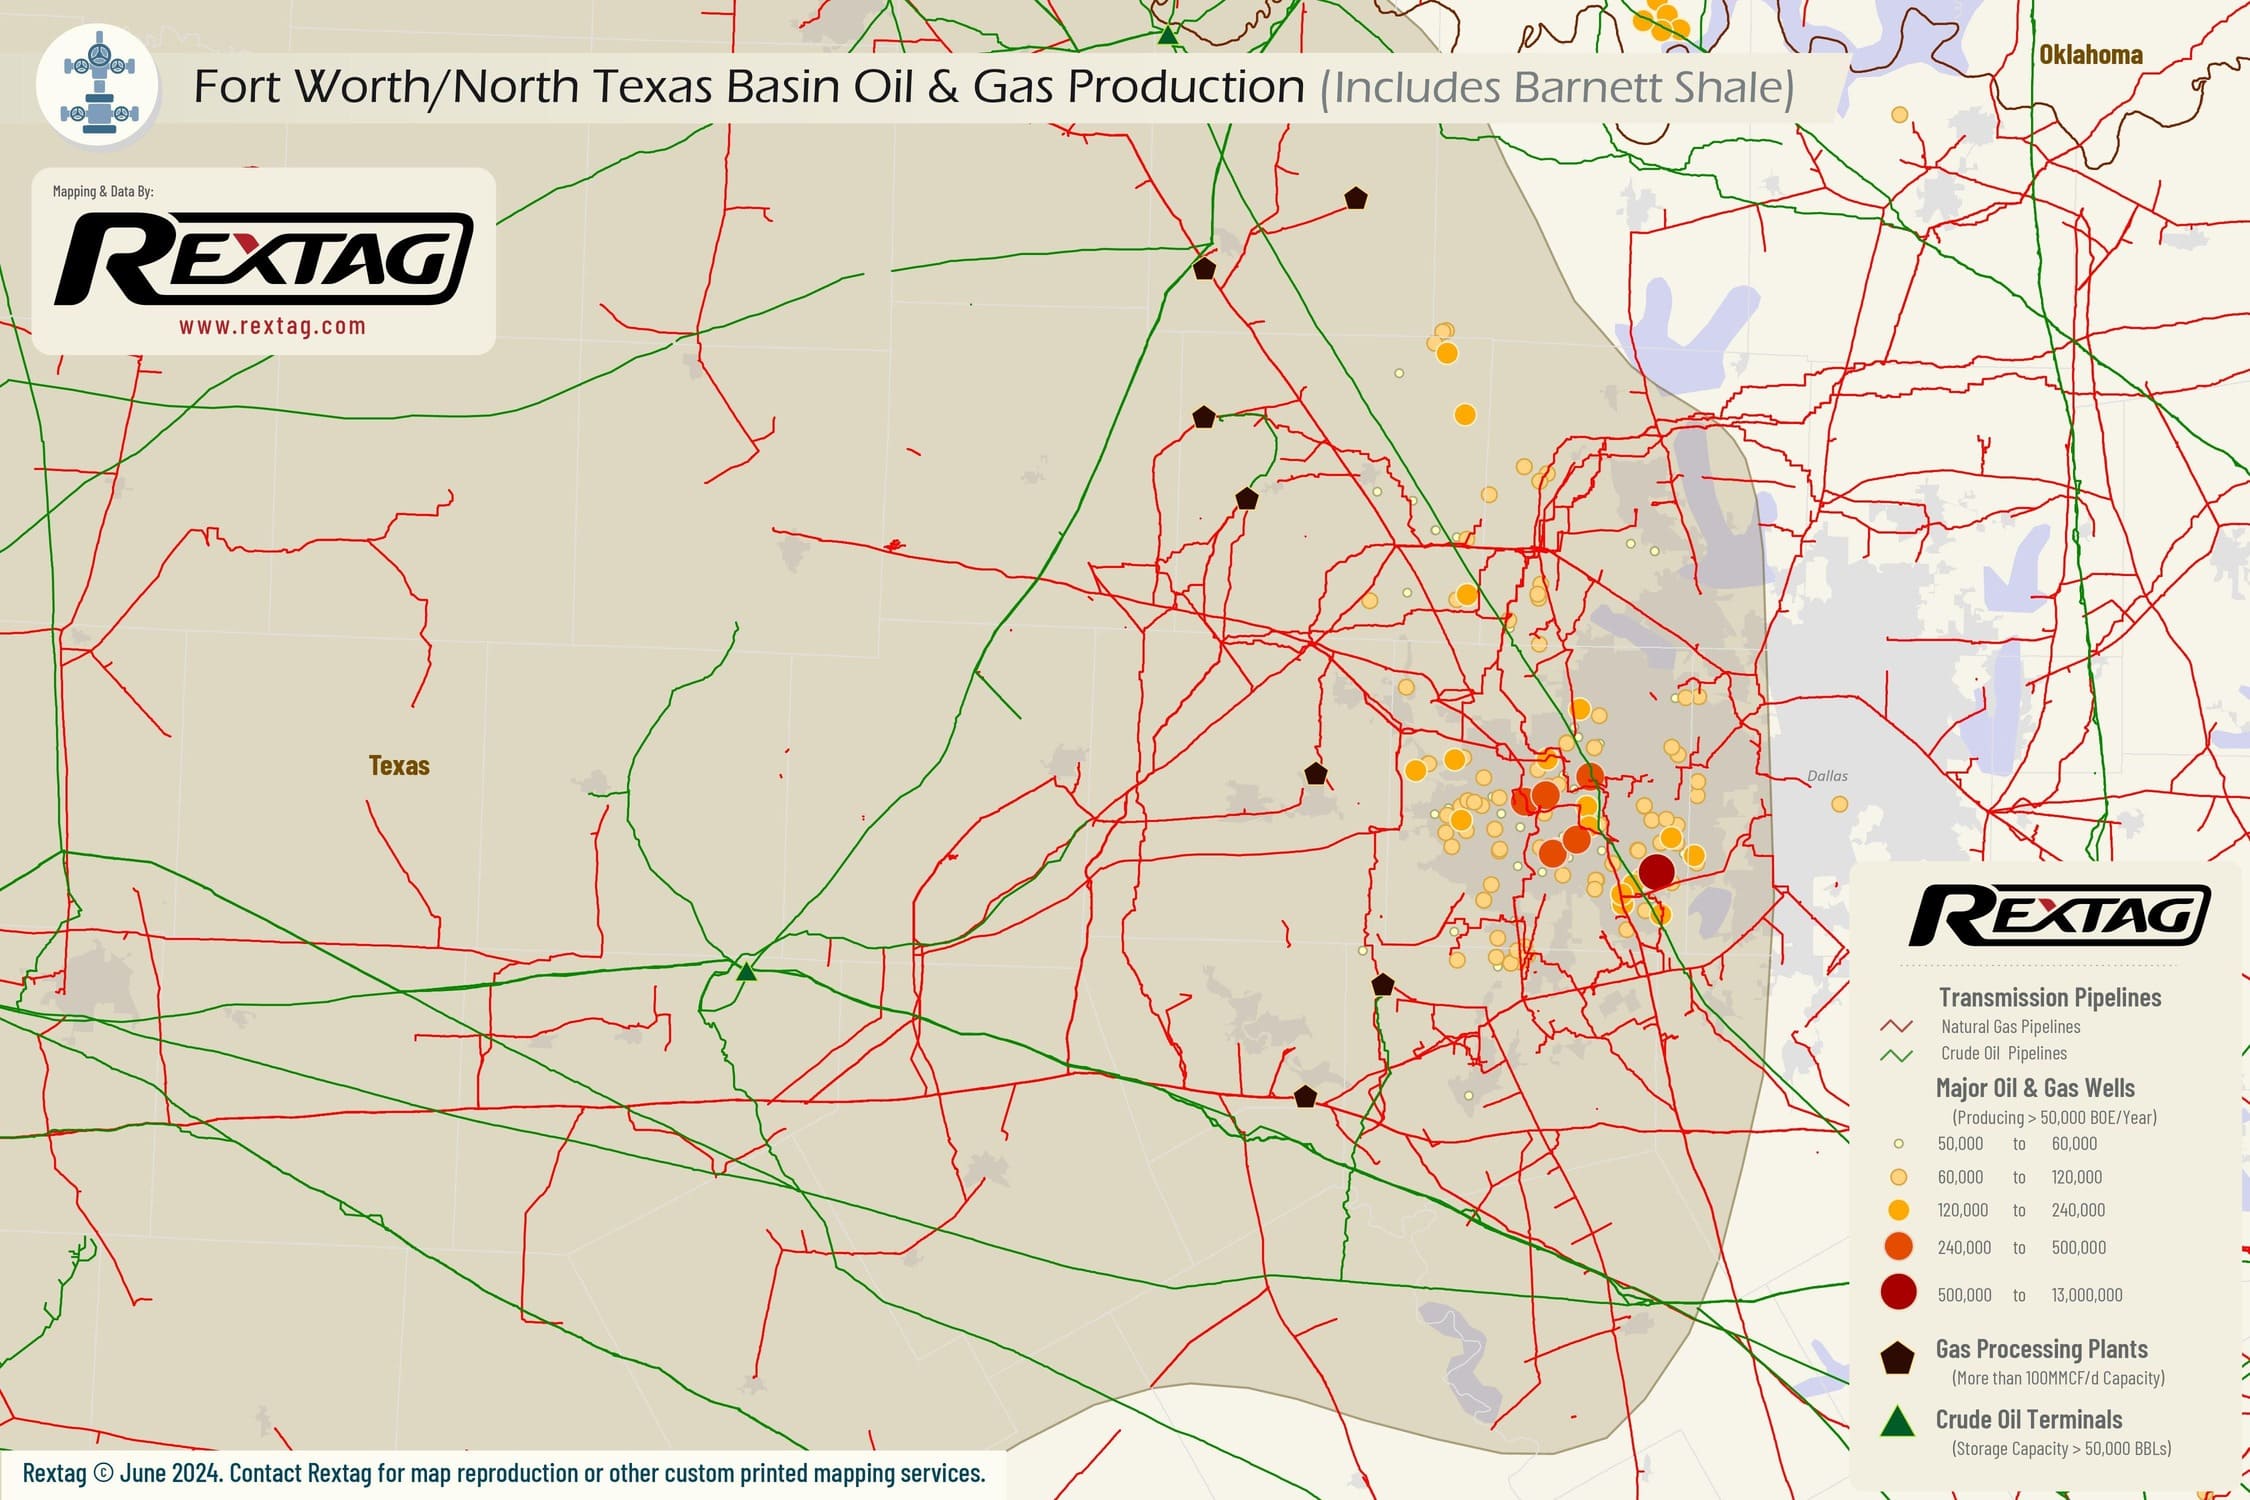
upstream oil and gas
Production Summaries
Monthly Production
Presented Data in the chart below is delayed - LOGIN FOR UPTODATE
Production by Operator
Production by Formation
Production by County
Top 10 wells
API Operator Trailing 12 Months BOE Total BOE Total Gas (MCF) Total Oil (BBL)
42-121-34598-0000 BKV Barnett, LLC 194,464.50 354,178.50 2,125,071.00 0.00
42-121-34606-0000 Bedrock Production, LLC 190,472.67 190,472.67 1,142,836.00 0.00
42-121-34607-0000 Bedrock Production, LLC 189,242.83 189,242.83 1,135,457.00 0.00
42-121-34624-0000 BKV Barnett, LLC 226,594.17 226,594.17 1,359,565.00 0.00
42-151-33211-0000 Moriah Operating, LLC 181,152.25 473,972.98 742,382.26 350,242.60
42-439-37256-0000 TEP Barnett USA, LLC 177,124.83 177,124.83 1,062,749.00 0.00
42-439-37257-0000 TEP Barnett USA, LLC 212,573.83 212,573.83 1,275,443.00 0.00
42-439-37292-0000 TEP Barnett USA, LLC 234,572.33 234,572.33 1,407,434.00 0.00
42-439-37294-0000 TEP Barnett USA, LLC 204,972.00 204,972.00 1,229,832.00 0.00
42-497-38102-0000 Sage Natural Resources, LLC 203,935.00 203,935.00 1,036,416.00 31,199.00
Completion Summaries
Avg Depths

Wells Depth

Min
0
Max
34,733
Avg
4,365

Wells Vertical Depth

Min
0
Max
15,990
Avg
541

Wells Lateral Length

Min
0
Max
13,190
Avg
740

Wells Measured Depth

Min
0
Max
37,469
Avg
477
Well Counts by Categories

Wells By Formation

Formation
Well Count
Barnett Shale
25,358
Strawn
8,217
Marble Falls
6,166
Congl
4,828
Caddo
4,758
Tannehill
4,140
Bend Congl Gas
3,290
Gunsight
2,430
Canyon Sand
2,021
Duffer
1,413

Wells By Status

Status
Well Count
Inactive, P/A
145,787
Active
43,838
Unknown
27,083
Shut-in
26,739
Cancelled
13,748
Permitted
1,656
Drilling
125

Wells By Trajectory

Trajectory
Well Count
Vertical
227,931
Horizontal
20,440
Unknown
9,537
Directional
1,221

Wells By Operator

Operator
Well Count
Banpu Kalnin Ventures
4,116
TEP Barnett USA
2,249
BKV
1,906
EOG
1,869
EagleRidge
1,822
Bedrock Production
1,147
Upp Operating
1,065
Dara Operating
1,048
Javelin Energy Partners MGMT
974
Diversified Production
955
Well Completions
Presented Data in the chart below is delayed - LOGIN FOR UPTODATE
Well Permits
Presented Data in the chart below is delayed - LOGIN FOR UPTODATE
Completion by Operators
Completion by County

Rextag Energy DataLink™ Comprehensive Energy Intelligence Energy DataLink provides the largest and most complete database on energy infrastructure assets in North America. The Energy DataLink database contains asset ownership, production records, processing capacities, physical locations, planned projects, acquisition records and much more.