Denver-Julesburg Basin (DJ / Includes Niobrara) - Upstream Oil & Gas

Description

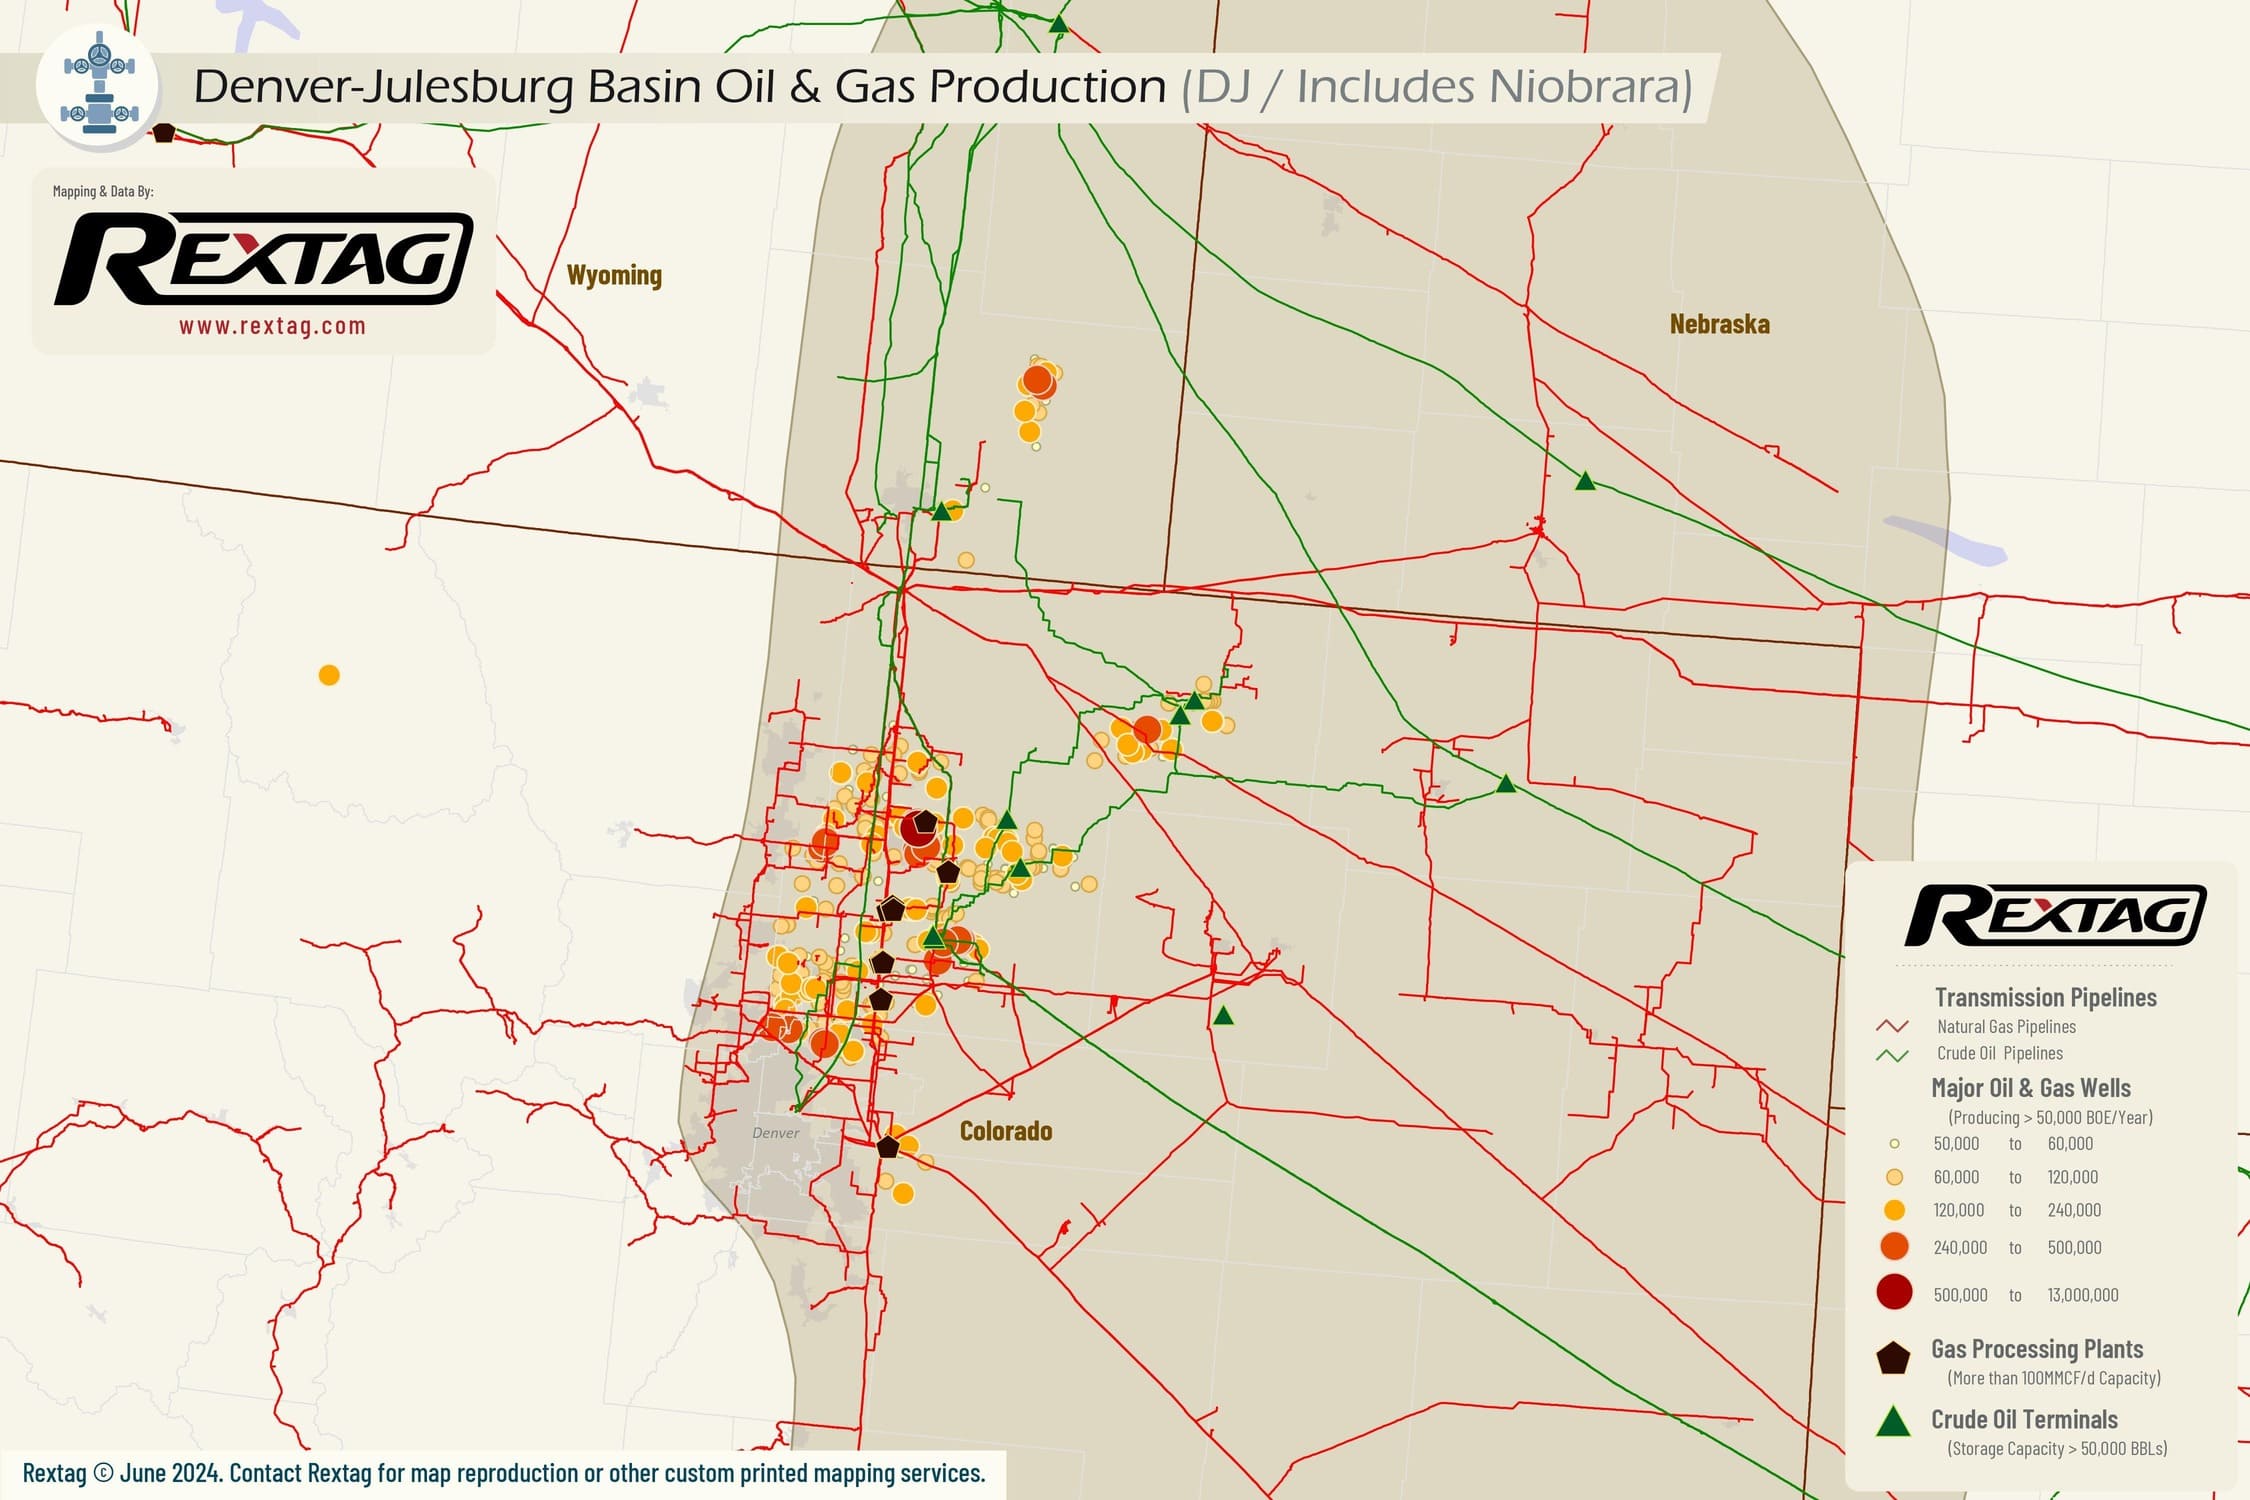
From 2019 to 2023, the Denver-Julesburg Basin in Colorado exhibited notable growth in oil and gas production. In 2019, the basin achieved an output of approximately 220 million barrels of oil. This production saw a decrease by 2021, reaching around 172 MBOE. Weld County, in particular, stood out as a significant contributor to this production. Statewide, Colorado reported productions for the last 12 months of 115 MBOE. By September 2023, the Denver-Julesburg Basin's oil production alone reached about 516,000 barrels per day, with total oil movements from the basin, including associated regions, peaking at 630,000 barrels per day during the same period.

upstream oil and gas
Production Summaries
Monthly Production
Presented Data in the chart below is delayed - LOGIN FOR UPTODATE
Production by Operator
Production by Formation
Production by County
Top 10 wells
API Operator Trailing 12 Months BOE Total BOE Total Gas (MCF) Total Oil (BBL)
05-123-48773-0000 Noble Energy, Inc. 327,976.67 333,096.33 653,438.00 224,190.00
05-123-48780-0000 Noble Energy, Inc. 294,987.17 298,324.50 500,649.00 214,883.00
05-123-48782-0000 Noble Energy, Inc. 288,281.67 296,345.83 648,647.00 188,238.00
05-123-48789-0000 Noble Energy, Inc. 288,447.33 293,726.00 571,800.00 198,426.00
05-123-49020-0000 Noble Energy, Inc. 323,978.17 323,978.17 1,093,267.00 141,767.00
05-123-51491-0000 Kerr-Mcgee Oil & Gas Onshore, LP 326,927.00 326,927.00 719,376.00 207,031.00
05-123-51684-0000 Kerr-Mcgee Oil & Gas Onshore, LP 290,325.00 449,844.50 1,137,333.00 260,289.00
05-123-51857-0000 Kerr-Mcgee Oil & Gas Onshore, LP 351,210.33 351,210.33 1,020,440.00 181,137.00
05-123-51859-0000 Kerr-Mcgee Oil & Gas Onshore, LP 308,838.67 308,838.67 821,740.00 171,882.00
05-123-51863-0000 Kerr-Mcgee Oil & Gas Onshore, LP 288,414.50 288,414.50 751,029.00 163,243.00
Completion Summaries
Avg Depths

Wells Depth

Min
0
Max
21,208
Avg
3,839

Wells Vertical Depth

Min
0
Max
21,208
Avg
3,448

Wells Lateral Length

Min
0
Max
21,540
Avg
1,688

Wells Measured Depth

Min
0
Max
29,046
Avg
7,356
Well Counts by Categories

Wells By Formation

Formation
Well Count
Niobrara
14,052
Niobrara - Codell
12,649
J Sand
4,145
Codell
4,030
Sussex
1,323
D Sand
979
Niobrara - Ft Hays - Codell
438
Codell - Fort Hays
431
Morrow
368
Sussex - Shannon
342

Wells By Status

Status
Well Count
Inactive, P/A
69,538
Active
18,326
Cancelled
10,210
Shut-in
7,224
Unknown
2,333
Permitted
1,155
Drilling
396
Orphan
1

Wells By Trajectory

Trajectory
Well Count
Unknown
63,451
Horizontal
29,583
Directional
8,633
Vertical
7,494

Wells By Operator

Operator
Well Count
Chevron
18,872
OXY
12,831
Own Resources Operating
3,831
Crestone Peak
2,238
PRE
2,199
K.P. Kauffman
1,450
HighPoint
1,172
Bonanza Creek
1,137
Fundare Resources
573
Omimex
475
Well Completions
Presented Data in the chart below is delayed - LOGIN FOR UPTODATE
Well Permits
Presented Data in the chart below is delayed - LOGIN FOR UPTODATE
Completion by Operators
Completion by County

Rextag Energy DataLink™ Comprehensive Energy Intelligence Energy DataLink provides the largest and most complete database on energy infrastructure assets in North America. The Energy DataLink database contains asset ownership, production records, processing capacities, physical locations, planned projects, acquisition records and much more.