Permian Basin (Includes Delaware & Midland) - Upstream Oil & Gas

Description

The Permian Basin, a key oil-producing region in the U.S., spans parts of Texas and New Mexico and has consistently demonstrated strong production performance. The daily production has seen a steady increase: starting from approximately 7 million BOE per day in June 2019, slightly rising in June 2020 to about 7,2 million BOE per day, then rising to 8,1 million BOE in June 2021, 9 million BOE in June 2022, and reaching 9,8 million BOE per day by June 2023. Key operators include Occidental Petroleum, Chevron, ExxonMobil, Pioneer Natural Resources, and ConocoPhillips.
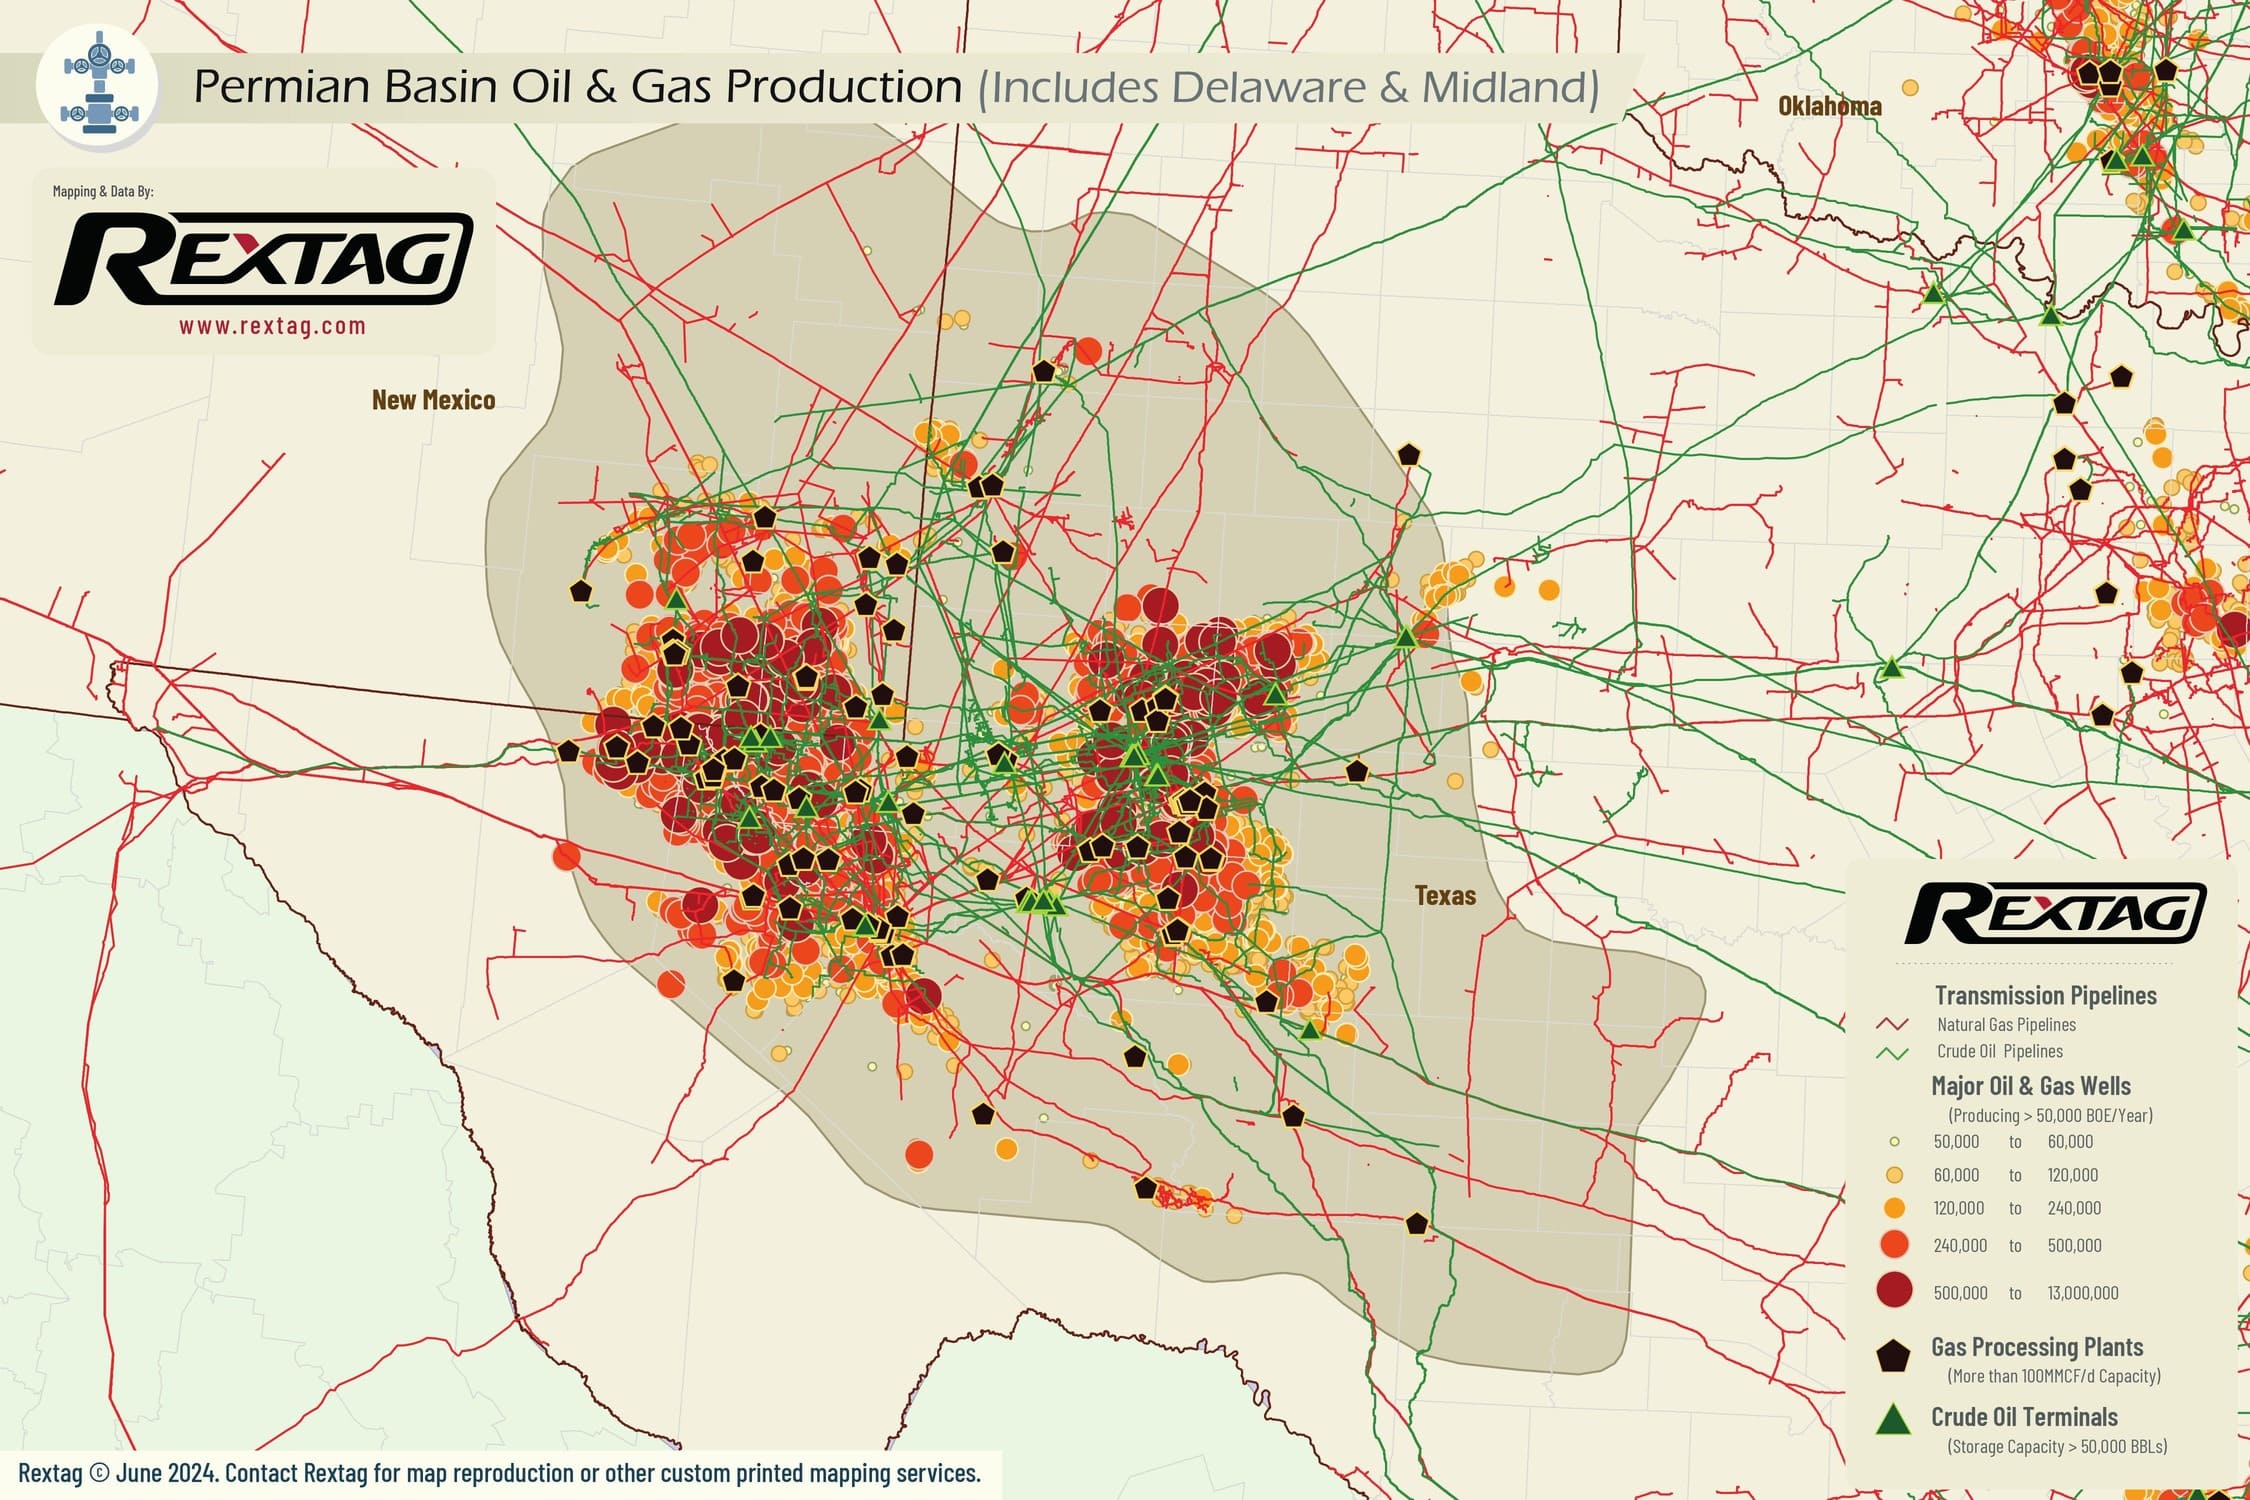
upstream oil and gas
Production Summaries
Monthly Production
Presented Data in the chart below is delayed - LOGIN FOR UPTODATE
Production by Operator
Production by Formation
Production by County
Top 10 wells
API Operator Trailing 12 Months BOE Total BOE Total Gas (MCF) Total Oil (BBL)
42-173-38391-0000 XTO Energy, Inc. 989,173.50 1,350,580.00 1,376,004.00 1,121,246.00
42-173-38542-0000 CrownQuest Operating, LLC 1,006,806.33 1,993,175.50 3,992,775.00 1,327,713.00
42-173-38666-0000 CrownQuest Operating, LLC 1,309,684.83 1,372,611.19 2,612,816.58 937,141.76
42-317-44396-0000 Endeavor Energy Resources, LP 1,062,809.95 1,062,809.95 1,636,081.39 790,129.72
42-329-45288-0000 Endeavor Energy Resources, LP 1,089,772.83 1,089,772.83 1,425,689.00 852,158.00
42-329-45291-0000 Endeavor Energy Resources, LP 1,334,098.00 1,334,098.00 1,614,150.00 1,065,073.00
42-389-40076-0000 Anadarko E&P Onshore, LLC 1,015,780.83 1,015,780.83 3,603,017.00 415,278.00
Completion Summaries
Avg Depths

Wells Depth

Min
0
Max
31,270
Avg
6,561

Wells Vertical Depth

Min
0
Max
25,515
Avg
2,668

Wells Lateral Length

Min
0
Max
21,095
Avg
833

Wells Measured Depth

Min
0
Max
29,673
Avg
2,810
Well Counts by Categories

Wells By Formation

Formation
Well Count
Trend Area
66,383
San Andres
30,853
Wolfcamp
24,279
Clear Fork
14,390
Canyon
11,418
Bone Spring
8,837
Cons
6,475
Delaware
6,219
Grayburg
5,397
Canyon Sand
4,439

Wells By Status

Status
Well Count
Active
150,899
Inactive, P/A
150,400
Shut-in
60,129
Unknown
31,922
Cancelled
18,602
Permitted
15,478
Drilling
969

Wells By Trajectory

Trajectory
Well Count
Vertical
310,351
Horizontal
74,606
Unknown
36,512
Directional
6,648

Wells By Operator

Operator
Well Count
OXY
32,868
Chevron
18,035
Apache
16,435
ExxonMobil
16,398
Pioneer
15,965
ConocoPhillips
15,003
Endeavor
6,703
Diamondback Energy
6,441
Upp Operating
5,621
Sabinal Energy
3,473
Well Completions
Presented Data in the chart below is delayed - LOGIN FOR UPTODATE
Well Permits
Presented Data in the chart below is delayed - LOGIN FOR UPTODATE
Completion by Operators
Completion by County

Rextag Energy DataLink™ Comprehensive Energy Intelligence Energy DataLink provides the largest and most complete database on energy infrastructure assets in North America. The Energy DataLink database contains asset ownership, production records, processing capacities, physical locations, planned projects, acquisition records and much more.